The Doji candle is a unique and powerful pattern in technical analysis. It appears on stock charts when a security’s opening and closing prices are nearly the same. This forms a candle with a very small or non-existent body and long shadows (the lines extending above and below the body), signifying market indecision between buyers and sellers. Understanding Doji candles is crucial because they often signal potential reversals or pauses in a trend, giving traders key insights into price movements.
What is a Doji Candle?
A candlestick represents a single period of price activity, showing the open, high, low, and close prices for that period. A Doji forms when the price fluctuates but ends the period close to where it started. This tells traders that neither buyers nor sellers were able to dominate the market, creating uncertainty about the next move.
The shape of the Doji candle may vary slightly, but the core concept is that the market opens and closes at nearly the same price. Depending on where the highs and lows of the period fall in relation to the body of the Doji, there are different types, which give more specific insights.
Types of Doji Candles
- Standard Doji: This Doji has a small or almost invisible body with equal-sized upper and lower shadows. It suggests market indecision without signaling a strong trend either way.
- Gravestone Doji: This type has a long upper shadow with little to no lower shadow. It occurs when the price opens low, rises sharply, but then closes near the open. It often signals a bearish reversal, especially after an uptrend.
- Dragonfly Doji: The Dragonfly Doji has a long lower shadow and no upper shadow. It forms when the price drops significantly but recovers, closing near the open. This can indicate a bullish reversal after a downtrend.
- Long-Legged Doji: This Doji shows long upper and lower shadows, meaning the price fluctuated widely but ended up at or near the open. This extreme indecision can signal a possible change in trend direction.
What Does the Doji Candle Tell Traders?
The Doji candle represents a balance between buyers and sellers, which can be a sign of upcoming changes. While it doesn’t always guarantee a reversal, it indicates a pause in the market where neither bulls (buyers) nor bears (sellers) are in control.
- In an uptrend, a Doji might suggest that buying pressure is weakening, and a reversal to the downside could happen.
- In a downtrend, a Doji could indicate that selling pressure is slowing down, hinting at a potential upward reversal.
However, traders often look for other signals to confirm these potential reversals, such as the formation of support and resistance levels or the appearance of other candlestick patterns.
Using Doji in Trading Strategies
A Doji is not a trade signal by itself but is often used in conjunction with other technical indicators. For example, if a Doji appears near a strong resistance level in an uptrend, it can suggest that the trend may be losing steam, and a reversal might occur. Conversely, a Doji near support levels in a downtrend might be a sign that sellers are running out of momentum, signaling a potential bounce or trend reversal.

Entry Point when Doji Appears
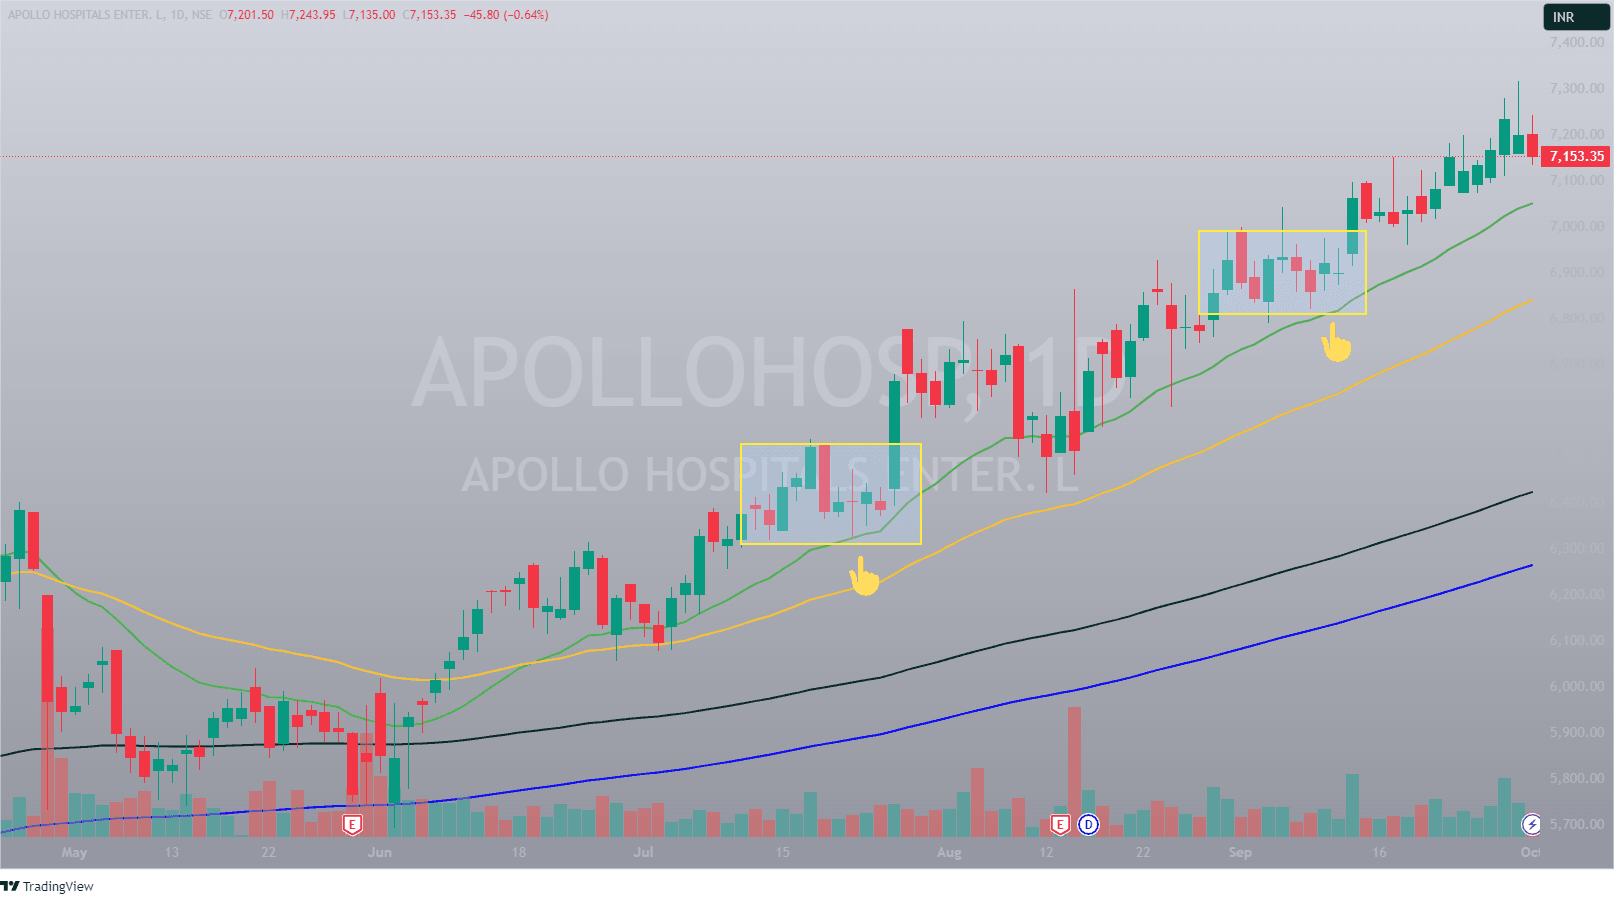
In the highlighted portion of the chart for Apollo Hospitals, a consolidation pattern is visible, with sideways movement after an upward trend. The yellow boxes mark areas of price hesitation or accumulation near the 10-day moving average (green line).
A potential Doji candle appears, representing indecision in the market. The ideal entry point would be the day after the Doji, when a clear breakout occurs. For bullish entry, a trade is initiated if the price moves above the Doji’s high with increased volume, signaling potential upward momentum.
Limitations of the Doji Candle
While the Doji is a helpful indicator, it’s important to remember that it’s not foolproof. In some cases, it may simply represent a temporary pause before the existing trend continues, known as a continuation pattern. Therefore, using it alongside other forms of analysis is essential for better accuracy.
For example, in a volatile market, a Doji might appear frequently without signaling any meaningful reversal. In such cases, traders should be cautious and consider the broader market context.
Conclusion
The Doji candle is a versatile and valuable tool for traders, offering insight into market indecision. By understanding the different types of Doji candles and their implications, traders can identify potential reversals or continuations in price trends. However, it’s crucial to use the Doji in combination with other indicators to avoid false signals and improve trading outcomes.
For traders who can interpret it effectively, the Doji can serve as a guide to market sentiment, helping them make more informed decisions in both uptrends and downtrends.


