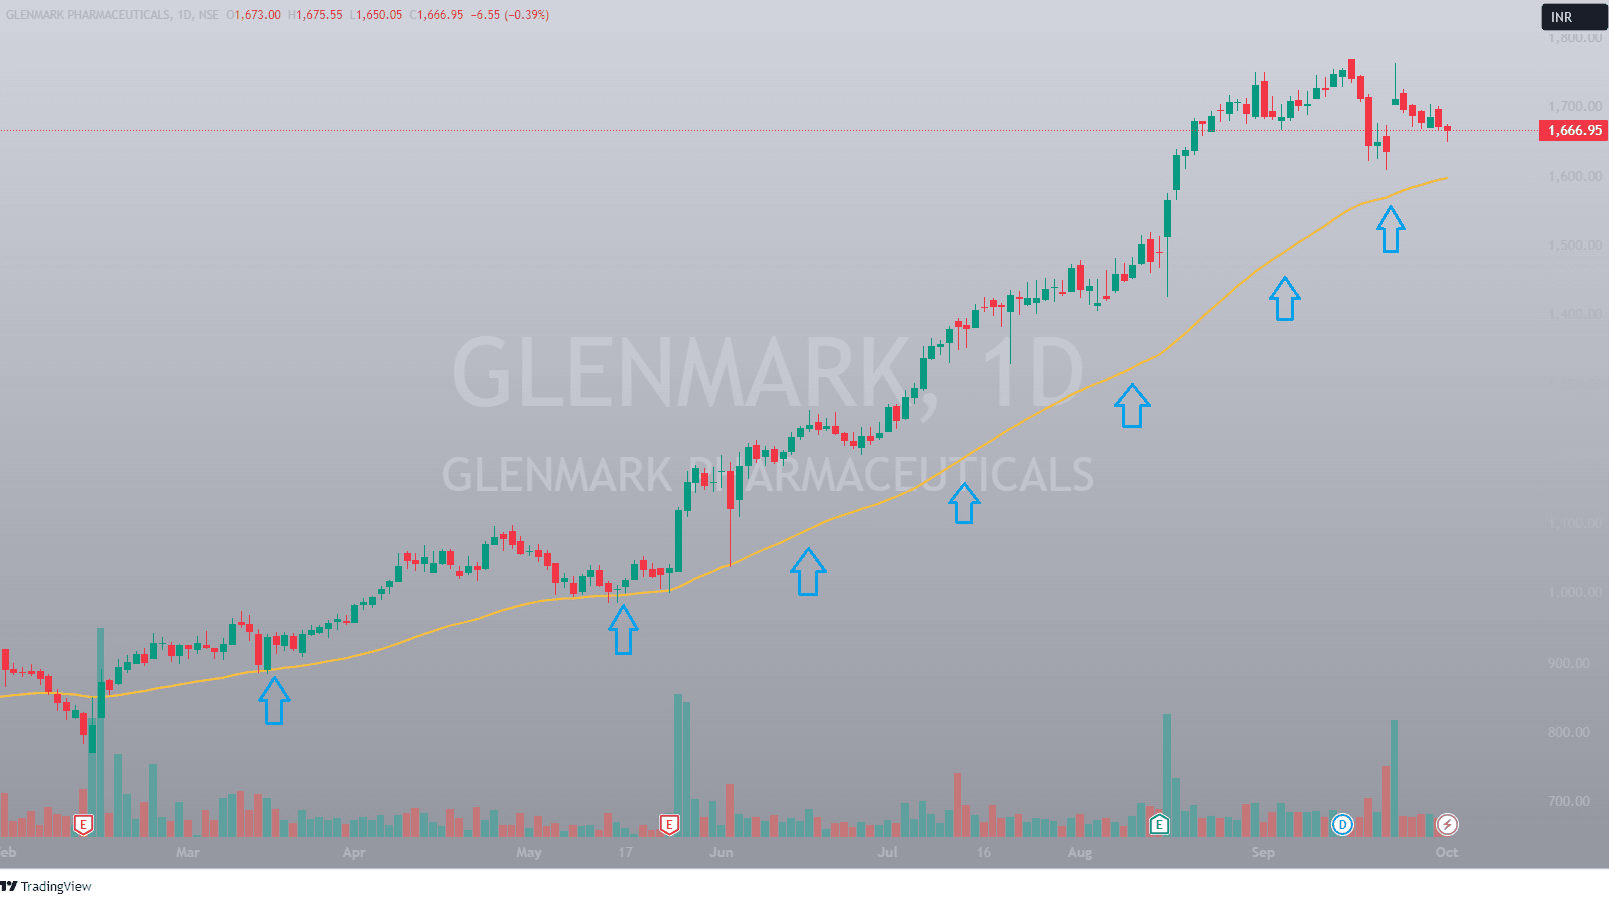
The 20 EMA (Exponential Moving Average) is a popular technical indicator used by traders to identify trends in stock prices. Unlike a Simple Moving Average (SMA), the EMA gives more weight to recent price data, making it more responsive to price changes. The 20 EMA specifically calculates the average price of a stock over the last 20 periods (e.g., days or hours), helping traders spot short-term trends.
How the 20 EMA Works
The 20 EMA works by smoothing out price fluctuations and creating a trendline that reflects the direction of the stock’s price movement over time. The “exponential” factor ensures that more recent prices have a stronger influence on the moving average than older prices, making it highly effective for identifying changes in momentum.
For example:
- Uptrend: When the stock price is above the 20 EMA, it signals an uptrend. Traders may look for buying opportunities in this scenario.
- Downtrend: When the price falls below the 20 EMA, it often indicates a downtrend. Traders may use this as a signal to sell or short-sell a stock.
Advantages of Using the 20 EMA
- Reactiveness to Price Changes: The 20 EMA responds more quickly to price movements compared to longer-term averages, allowing traders to act on emerging trends sooner.
- Versatile Across Timeframes: The 20 EMA can be applied across various timeframes—daily, hourly, or even minute-by-minute—depending on the trader’s strategy. Short-term traders often use it to capitalize on quick movements, while long-term investors may use it as part of a broader trend analysis.
- Effective in Trending Markets: The 20 EMA works best in trending markets, where prices are consistently moving in one direction. It helps traders stay in the trend longer by acting as dynamic support or resistance levels.
How to Use the 20 EMA in Trading
- Crossover Strategy: One common method is to combine the 20 EMA with a longer-term moving average, like the 50 or 200 EMA. When the 20 EMA crosses above the longer EMA, it’s often seen as a bullish signal (buying opportunity). Conversely, when it crosses below, it’s a bearish signal (selling opportunity).
- Support and Resistance: The 20 EMA can also act as a dynamic support or resistance level. For example, in an uptrend, if the stock pulls back and touches the 20 EMA but bounces back, it may indicate that the trend is still intact.
- Trend Confirmation: Traders often use the 20 EMA as a trend confirmation tool. If a stock is trading above the 20 EMA, traders may feel more confident in taking long positions. Similarly, if the stock is below the 20 EMA, short positions may be favored.
Limitations of the 20 EMA
- False Signals in Ranging Markets: In sideways or non-trending markets, the 20 EMA may generate false signals, leading to potential losses if used in isolation. Combining the 20 EMA with other indicators like the Relative Strength Index (RSI) or MACD can help filter out false signals.
- Lagging Indicator: Despite its responsiveness, the 20 EMA is still a lagging indicator because it is based on historical price data. It may not fully capture sudden price reversals or major news-driven events.
Example of 20 EMA in Action
Let’s consider a stock that’s been in an uptrend for a few weeks. The price consistently stays above the 20 EMA, confirming a bullish trend. If the stock pulls back toward the 20 EMA but doesn’t break below it, a trader might see this as an opportunity to enter or add to a long position, anticipating that the trend will continue.

On the other hand, if the stock breaks below the 20 EMA and the line starts sloping downward, it could signal that the uptrend is weakening, prompting the trader to exit or consider a short position.
20 EMA vs. 50 EMA
Traders often compare the 20 EMA with longer-term averages like the 50 EMA. While the 20 EMA is more suited for identifying short-term trends, the 50 EMA is better for longer-term trend analysis. Many traders use both in conjunction to get a clearer picture of a stock’s overall direction. For example, if the 20 EMA is above the 50 EMA, it confirms a strong upward trend, and vice versa.
Conclusion: Is the 20 EMA Right for You?
The 20 EMA is an essential tool for many traders, particularly those focused on short-term price movements. Its ability to quickly adapt to changes in stock price makes it a favorite for traders looking to identify trends and capitalize on market momentum. However, like any indicator, it’s most effective when used in combination with other tools and techniques. Understanding the limitations and strengths of the 20 EMA will help traders make better-informed decisions and reduce the risk of false signals.
In summary, the 20 EMA is a powerful and flexible tool for both beginner and advanced traders, allowing them to quickly spot trends, identify potential entry and exit points, and stay on the right side of the market.
Also Read : Guide to the Doji Candle: A Key Indicator in Stock Trading


