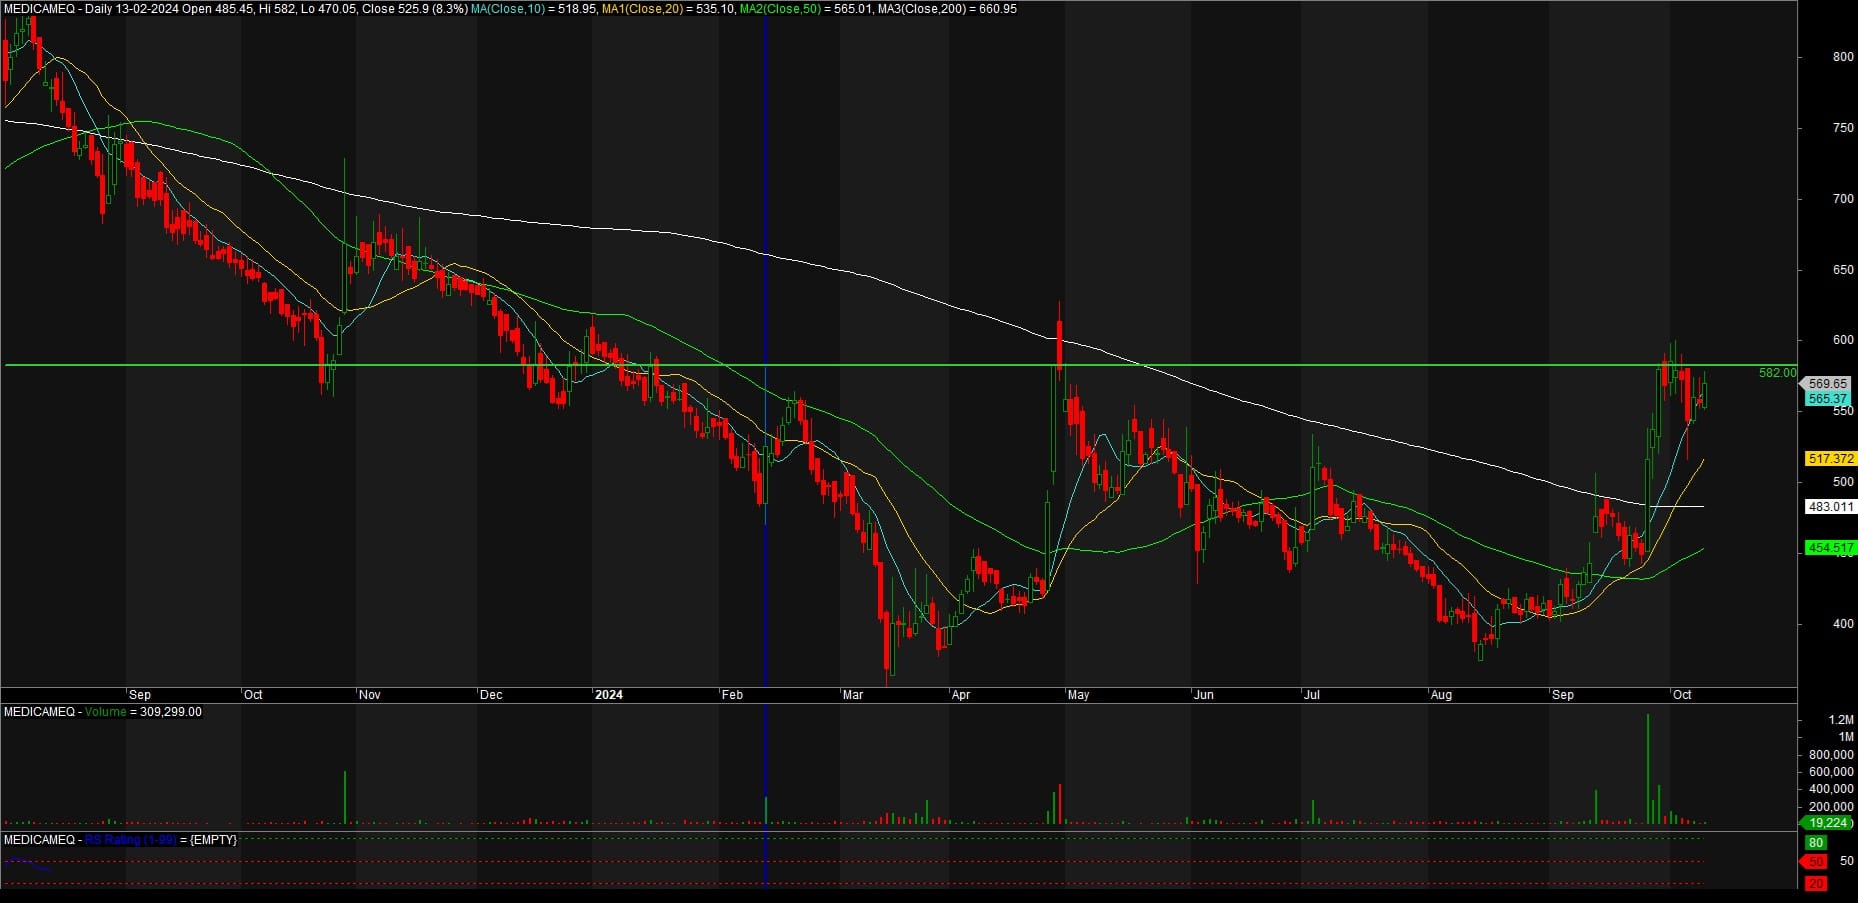
Medicamen Biotech, a growing name in the pharmaceutical industry, has garnered attention for its innovative approach and expanding portfolio in life-saving drugs. This blog will analyze the stock price trends of Medicamen Biotech, focusing on the technical signals from the chart provided and interpreting what they might mean for future performance.
1. Overview of the Stock Chart
From the chart, we can see that Medicamen Biotech has experienced a turbulent year, with the price reflecting a steady decline for much of 2023, followed by a strong recovery starting in mid-2024. The following sections will dive deeper into these patterns and what they indicate for potential investors.
2. Key Technical Indicators
Several technical indicators can be observed from the chart, including moving averages, support, and resistance levels. These indicators are essential for understanding the stock’s historical performance and anticipating future price movements.

A. Moving Averages
The chart includes three moving averages:
- 10-day moving average (Sky Blue)
- 20-day moving average (Yellow)
- 50-day moving average (Green)
- 200-day moving average (White)
The 10- and 20-day moving averages have crossed over the 50-day moving average, suggesting a bullish trend in the short to medium term. The 200-day moving average, which often represents longer-term trends, remains above the current stock price, indicating that the stock is still recovering from a long-term downtrend.
Key Observation: When the shorter-term moving averages (10 and 20-day) cross above longer-term moving averages, it’s typically seen as a bullish signal. This “golden cross” suggests momentum is turning positive, especially when supported by increased trading volume, as shown in the chart.
B. Support and Resistance Levels
- Resistance Level: The stock recently touched a significant resistance point around ₹582, a level that the stock has struggled to surpass. In technical analysis, resistance levels are price points where selling pressure typically exceeds buying demand, making it difficult for the stock to break above this level.
- Support Level: The stock has a critical support level around ₹454, which it tested multiple times earlier in 2024. This is a key level to watch, as a drop below it could signal a reversal of the current uptrend.
Key Observation: The stock is currently testing its upper resistance at ₹582. A breakout above this level, especially with strong volume, could indicate further upside potential of 20% move . However, failure to break through could result in a pullback toward support levels.
3. Price Action and Market Sentiment
A. Downtrend and Consolidation (2023)
From mid-2023, the stock experienced a prolonged downtrend, with prices falling from approximately ₹850 to around ₹450. This decline could have been driven by broader market conditions, profit-taking, or a slowdown in the company’s financial performance. However, the stock found a strong support base around ₹450, where selling pressure eased, and buyers began to step in.
B. Recovery and Uptrend (2024)
The most noticeable feature on the chart is the sharp recovery that started in mid-2024. The stock rose quickly from the support level of ₹454, breaking through its 50-day moving average and heading toward the ₹582 resistance level. This upward momentum could be attributed to positive news, improved earnings reports, or favorable developments in the biotech industry, especially for Medicamen.
The stock’s current position just below the resistance at ₹582 suggests that investors are cautiously optimistic. Market sentiment appears to have shifted toward the positive, but a clear breakout past ₹582 would be needed to confirm sustained bullish sentiment.
4. Volume Analysis
Volume is a critical indicator in understanding the strength of price movements. In this chart, we see an increase in volume accompanying the recent price surge, indicating strong buying interest. Higher volumes during upward price movements tend to confirm the validity of the trend, as more market participants are willing to pay higher prices for the stock.
Key Observation: Increased volume during the recent uptrend suggests strong buyer confidence. If this trend continues and the stock breaks above ₹582, it could lead to further gains.
Also Read : Pharmaceutical Excellence: Why Piramal Pharma Should Be in Your Portfolio
5. Outlook and What to Watch
A. Bullish Scenario
If the stock breaks above the ₹582 resistance level with significant volume, it could signal a continuation of the uptrend. In this case, the next resistance levels to watch would be around ₹650 and potentially higher, possibly approaching ₹700. Investors looking for entry points might consider waiting for a breakout confirmation.
B. Bearish Scenario
Conversely, if the stock fails to break the ₹582 resistance, it could retrace to test the support levels at ₹517 or even ₹454. A drop below ₹454 would be particularly concerning, as it would suggest a reversal of the current recovery and could lead to further downside.
6. Fundamental Factors to Consider
Beyond the technical analysis, it’s essential to consider the company’s fundamentals. Medicamen Biotech operates in a highly competitive and regulated industry, and its financial performance is subject to the approval of new drugs, R&D expenses, and market penetration.
Investors should stay updated on:
- Earnings Reports: Strong financial results can propel the stock higher.
- Product Pipeline: Successful drug approvals or partnerships can boost investor confidence.
- Industry Trends: The biotech sector’s performance can influence stock prices. Positive regulatory changes or breakthroughs in treatments can impact market sentiment.
7. Conclusion
Medicamen Biotech’s stock is showing promising signs of recovery, backed by strong technical indicators like the crossing of moving averages and rising volume. However, the stock is currently at a critical juncture, testing its resistance at ₹582. A breakout above this level could signal further upside, while failure to do so might lead to a pullback.
Investors should keep an eye on volume trends, earnings reports, and broader market conditions when making decisions. The next few weeks will be crucial in determining whether Medicamen Biotech’s stock continues its upward trajectory or faces resistance.
As always, it’s advisable to combine technical analysis with fundamental insights for a well-rounded investment decision.


